In this series on Endpoint Analytics we explore the different reports and possibilities that Endpoint Analytics currently offers. In part 1 we discussed the advantages of XLA over SLA, how to enable Endpoint Analytics and onboard Intune clients using a data collection policy. In this post (Part 2) we will have a closer looks at Startup Performance, the first of three areas that Endpoint Analytics provides insight into.
Contents
Related Posts:
- Part 1 – Getting Started with Endpoint Analytics
- Part 2 – Startup Performance (this post)
- Part 3 – Proactive Remediation’s
- Part 4 – Recommended Software
- Part 5 – Restart Frequency
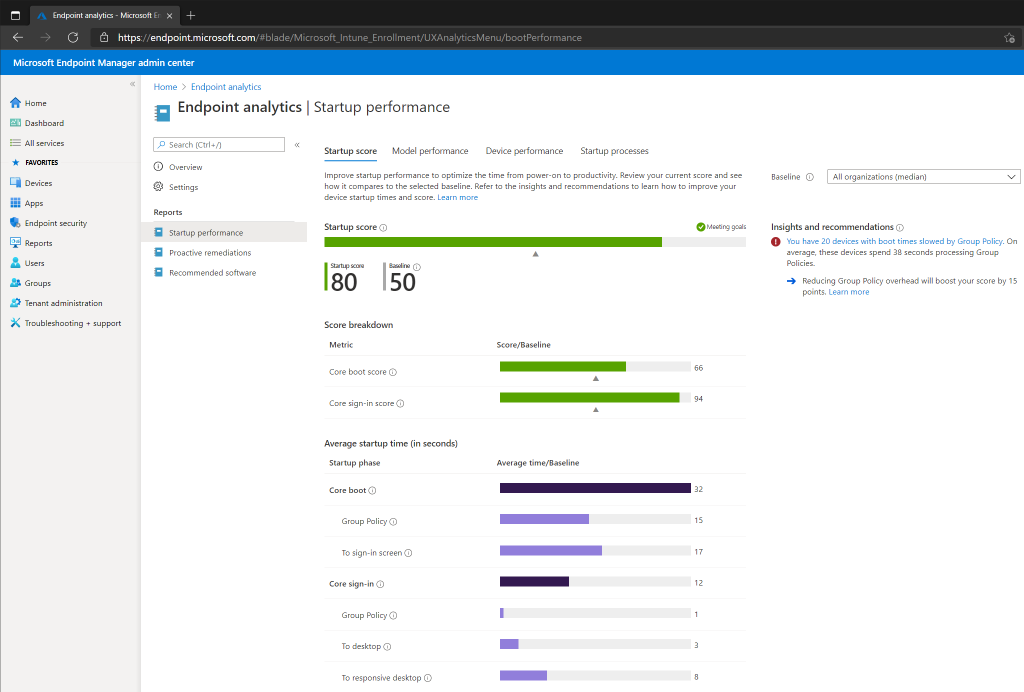
Startup Score
The startup score is a number between 0 and 100, where 0 is poor and 100 is exceptional. As mentioned in Part 1, only Intune devices that meet the following requirements will report Startup Performance data to Endpoint Analytics (Configuration Manager clients do not need to meet these criteria).
- Windows 10 Enterprise, Education or Pro, version 1903 or later (latest version is always recommended)
- Windows 10 Pro versions 1903 and 1909 require KB4577062.
- Windows 10 Pro versions 2004 and 20H2 require KB4577063.
- Azure AD Joined / Hybrid Joined
Here is a breakdown of the different metrics for Startup Performance:
- Startup Score – Based on a number between 0 and 100 and is a weighted average of the Boot and Sign-in Scores.
- Boot Score – Calculated based on the time from power-on until sign in. The update phase is excluded so that any updates will not affect the score.
- Sign-in Score – Calculated based on the time from sign-in until the desktop is responsive. Microsoft’s definition of a responsive desktop is a fully rendered desktop, and less than 50% CPU usage for at least 2 seconds. The first sign-in is not included in the score, neither is the first sign-in after a feature update.
Model Performance
Model Performance allows us to get insights for specific device models in our environment. If we have indications that a particular model is not providing the expected performance, we can do a quick comparison to other models and can possibly identify performance issues related to a specific hardware model. Devices will not be listed in the view unless there are multiple devices (10) of the same hardware model.
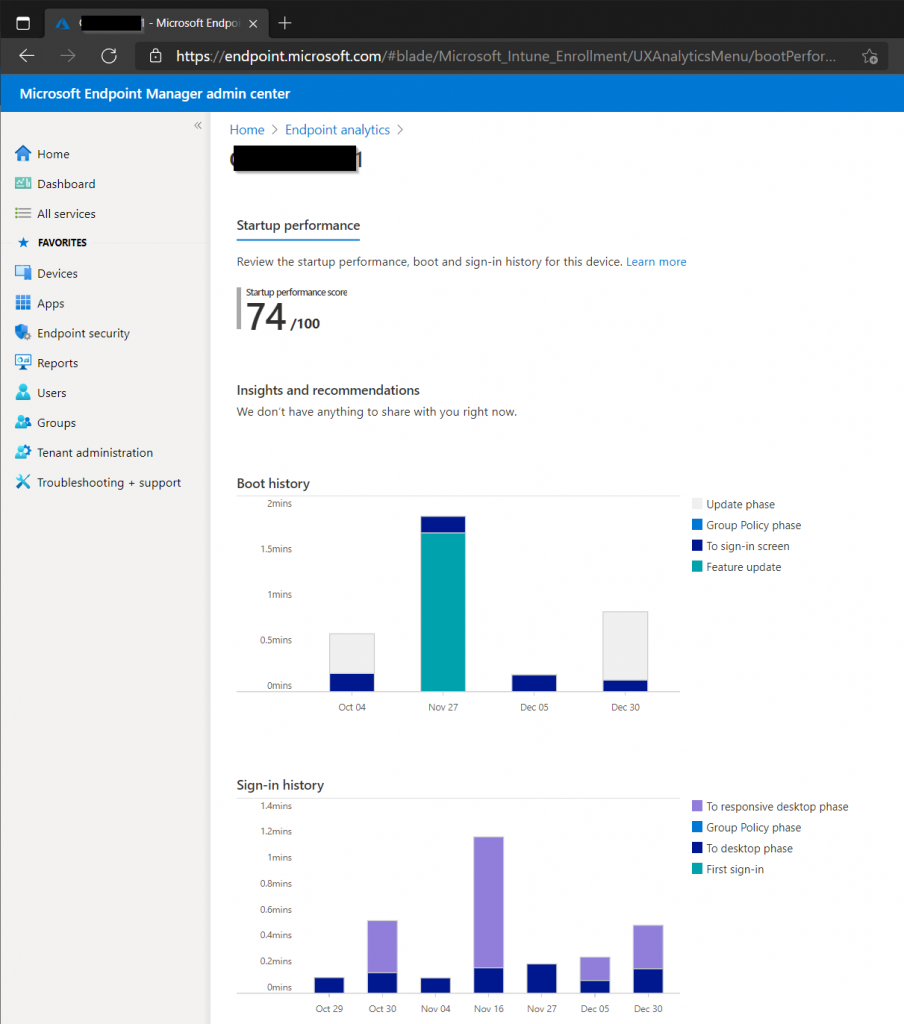
Device Performance
In Device Performance we can get insights into each individual device and see their boot and sign-in score. We can also explore each individual device further. In the below screenshot we can see that the device had a feature update on November 27, and there was something that caused the device to use more time before a responsive desktop was reached on November 16. Providing your operational team with these types of insights can help troubleshoot performance issues reported by the user, or help in proactive decisions.
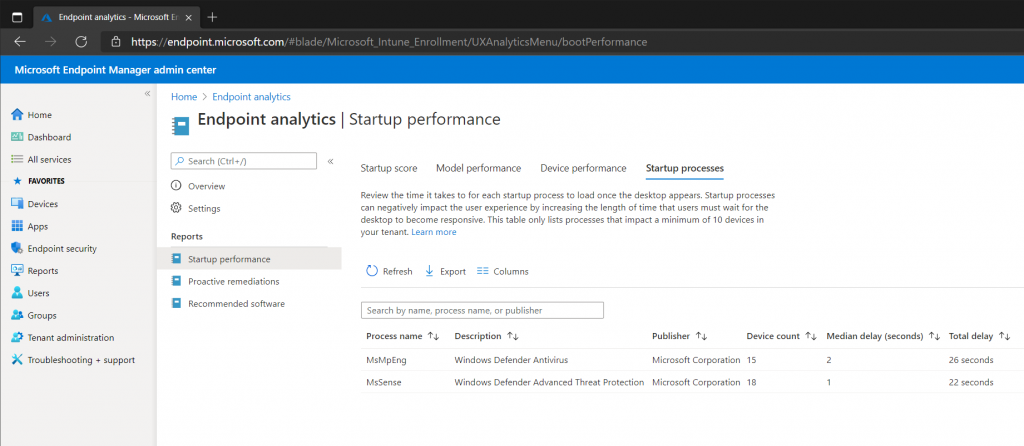
Startup Processes
Any process that causes an increase in the time a user must wait for a responsive desktop will be displayed here. In addition to the Process Name, Description and Publisher the following additional information is provided:
- Device Count – The amount of devices that experienced a delay caused by that particular process.
- Median Delay – Displays the median (middle number) delay time for the counted devices.
- Total Delay – The total delay experienced by all the counted devices.
Since the table only displays processes that have made an impact on more than 10 devices, the amount of processes are limited in this lab environment.
In Part 3 we will have a look at how we can use PowerShell and Proactive Remediation’s to detect and remediate issues on end-user devices.
- Part 1 – Getting Started with Endpoint Analytics
- Part 2 – Startup Performance (this post)
- Part 3 – Proactive Remediation’s
- Part 4 – Recommended Software
- Part 5 – Restart Frequency