When an organization purchase a service they usually get some kind of SLA (Service Level Agreement) that dictates how that service is measured and if the vendor will pay penalties if those metrics are not met. A good example is uptime or availability. Most vendors will guarantee the availability of a service to a certain extent, Microsoft 365 has an SLA of 99.9%. This is great, but a struggling user couldn’t care less about 99.9% service availability if the service is not working as advertised for them.
By leveraging XLA or Experience Level Agreement we change that focus to each individual user and measure their experience using the service, instead of focusing only on availability and processes. Making proactive changes based on telemetry and metrics will improve the end-user experience, increase productivity and hopefully add business value to the the organization. By collecting metrics such as boot times, we can identify devices in the organization that should be upgraded or replaced without the end-user needing to create a ticket with helpdesk first. Another example could be battery information. Who wouldn’t be positively surprised if IT knocked on the door with a new battery, because they had telemetry that indicated the battery should be replaced. There are many examples of how different metrics can be used to provide a more proactive experience for our end-users.
The bottom line is that happy users drive productivity. Endpoint Analytics is Microsoft’s attempt to give administrators a little insight into that end-user experience. There are many other tools that in my honest opinion do a much better job than Endpoint Analytics, due to it’s rather limited feature set as of now. However if your organization is using either Intune or Configuration Manager then you are already licensed, and can take advantage of the insights that Endpoint Analytics have to offer. Hopefully Microsoft will continue to invest into Endpoint Analytics as this could turn into a really great product!
Contents
Related Posts:
- Part 1 – Getting Started with Endpoint Analytics (this post)
- Part 2 – Startup Performance
- Part 3 – Proactive Remediation’s
- Part 4 – Recommended Software
- Part 5 – Restart Frequency
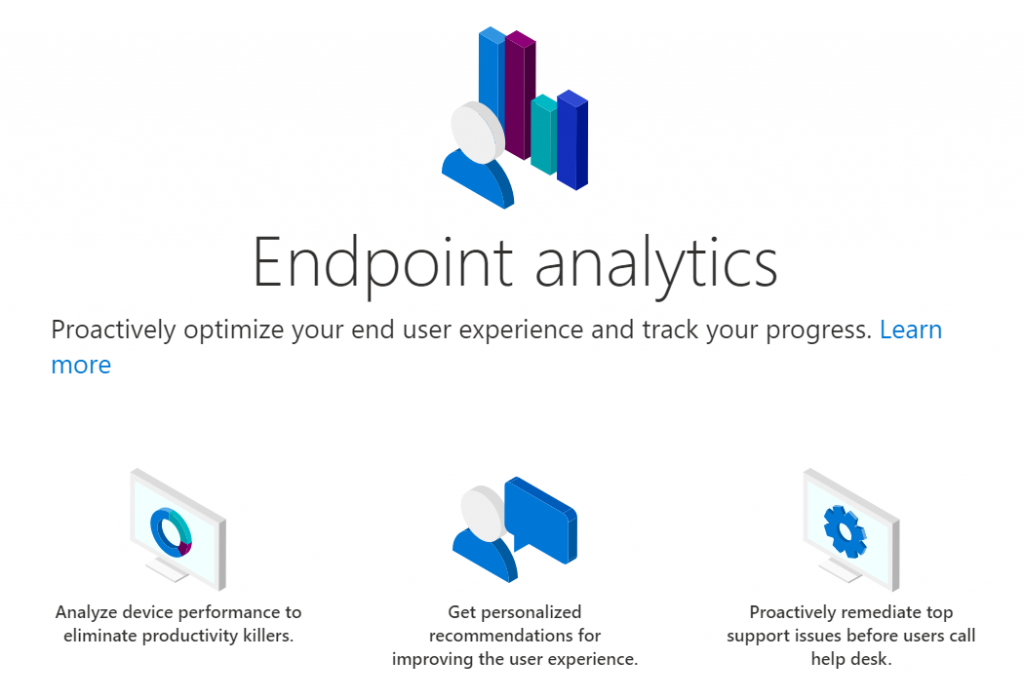
Endpoint Analytics Overview
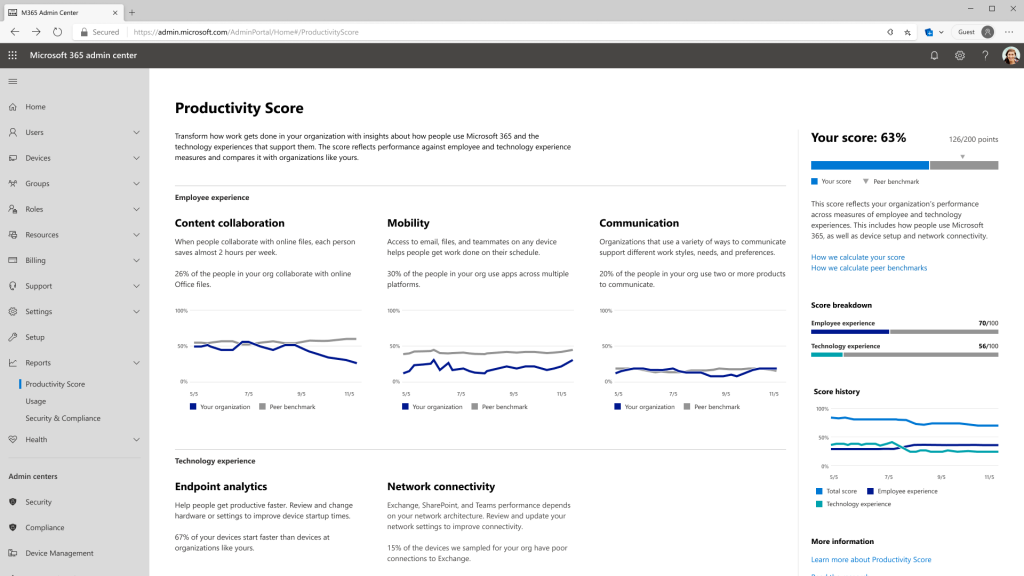
Endpoint Analytics is part of the Microsoft Productivity Score and aims to provide IT Administrators with an understanding of what kind of experience end-users are having. The Productivity Score is “the journey to digital transformation with insights about how your organization uses Microsoft 365 and the technology experiences that support it”. Productivity score can be enabled in the Microsoft 365 Admin Center (https://admin.microsoft.com).
Currently Microsoft has given us insight in to three different areas in Endpoint Analytics:
- Startup Performance – insight into your devices boot performance, how long does it take before users can start being productive from the time they power-on their device?
- Proactive Remediation – Use PowerShell scripts to detect and remediate issues proactively
- Recommended Software – Recommendations from Microsoft that provide the best user experience.
Two new features have been in Private Preview for some time and will hopefully enter the public preview stage in early 2021. The two new features are:
- Application Reliability – Understand which desktop applications are getting in the way of end-user productivity and how to remediate this.
- OS Restarts – Determine when and why devices restart, assist administrators with identifying spikes in unexpected restarts cause by for example blue screens.
Endpoint Analytics Requirements
Endpoint Analytics can be used with Intune and Configuration Manager or a combination of the two. Each user needs to be assigned a valid license for Endpoint Manager (Intune License), however to take advantage of Proactive Recommendations which is a sub-component of Endpoint Analytics one of the following licenses is required:
- Windows 10 Enterprise E3 or E5 (included in Microsoft 365 F3, E3, or E5)
- Windows 10 Education A3 or A5 (included in Microsoft 365 A3 or A5)
- Windows Virtual Desktop Access E3 or E5
There are also some Windows 10 requirements for Intune devices. If your organization don’t meet these requirements it is still possible to onboard through Configuration Manager.
- Windows 10 Enterprise, Education or Pro, version 1903 or later (latest version is always recommended)
- Windows 10 Pro versions 1903 and 1909 require KB4577062.
- Windows 10 Pro versions 2004 and 20H2 require KB4577063.
- Azure AD Joined
Additionally the Intune Service Administrator is required to enable data collection, and since Endpoint Analytics is a cloud based service, devices must be able to communicate with Microsoft service-endpoints in the cloud.
Getting Started With Endpoint Analytics
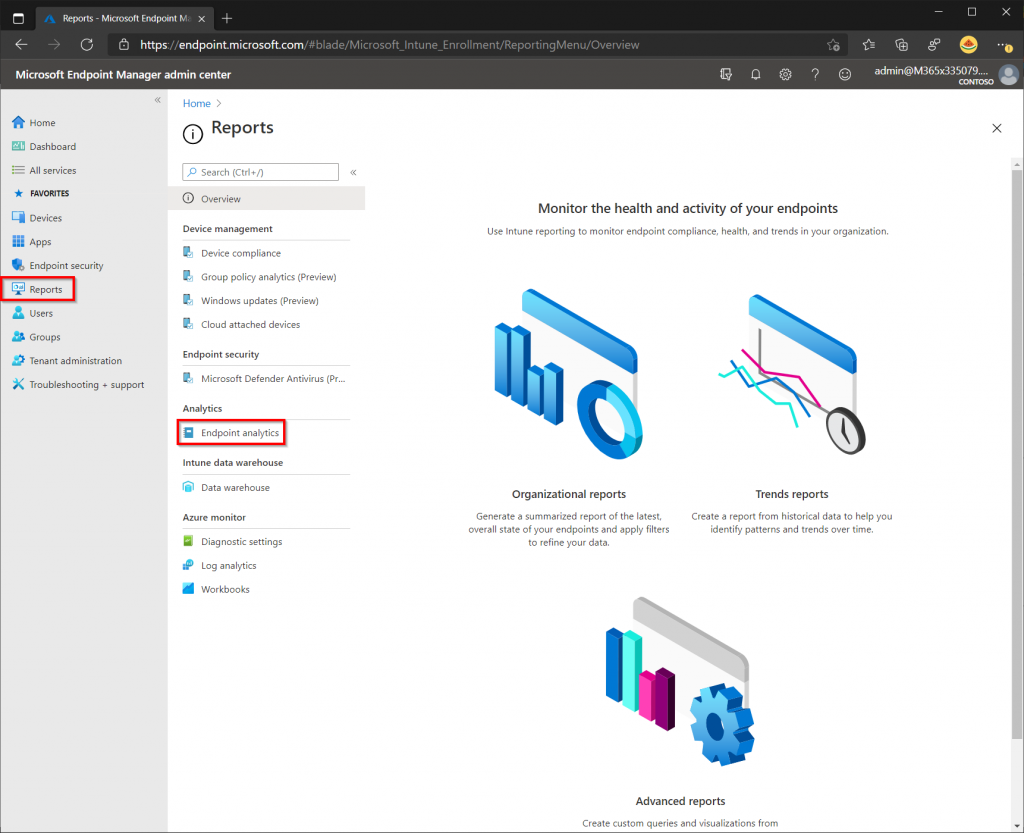
In the Microsoft Endpoint Manager Admin Center select the Reports pane on the left side then select Endpoint Analytics under the Analytics section. Alternatively use the following URL that takes you directly to Endpoint Analytics: https://aka.ms/endpointanalytics.
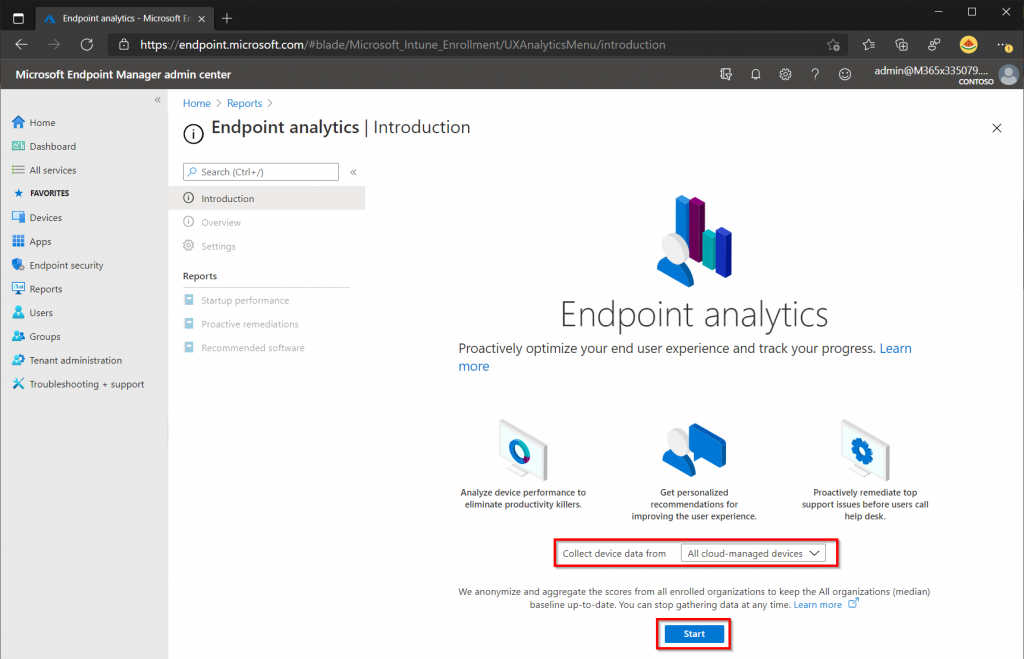
To enable Endpoint Analytics simply click the start button (this button is only displayed once). Notice the dropdown window that says “All Cloud Managed Devices”, this will automatically create a policy in Intune and enable Endpoint Analytics for all devices. Select the option that suits your needs.
- All cloud-managed devices: Creates an Intune data collection policy assigned to all Windows 10 1903 or later devices which are either Intune managed or co-managed.
- Selected devices: Creates and assigns the policy to devices which you select.
- I’ll choose later: Doesn’t deploy a policy to devices. Proactive remediation’s can still be used, but any reports that rely on analytics data will be empty.
The options in Endpoint Analytics should become visible, once the Start button has been pressed.
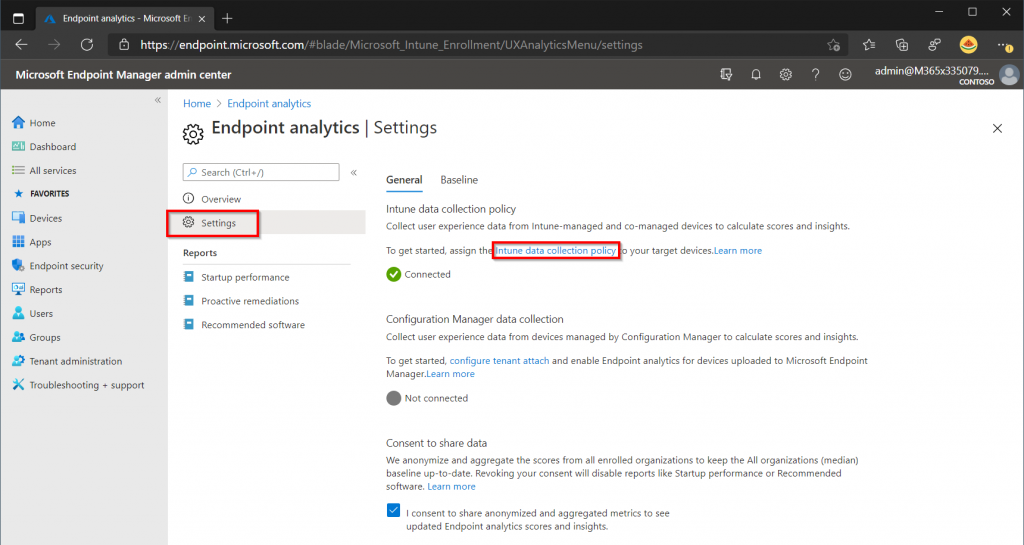
Select Settings from the Endpoint Managed blade then click Intune Data Collection Policy to view the data collection policy that was automatically created in the previous step. Note that it is possible to withdraw the consent to share anonymized and aggregated metrics with Microsoft at the bottom of the settings page (Doing this will reduce the functionality of Endpoint Analytics).
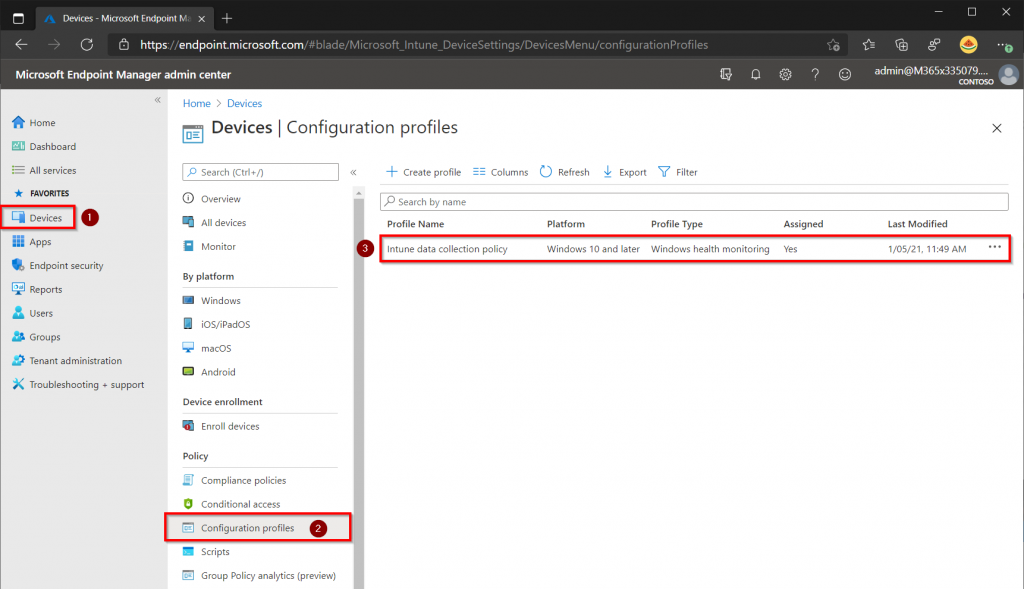
The data collection policy for Intune devices can also be modified directly from the Configuration Profiles page in Intune. To reach the Configuration Profiles page, click the Devices blade on the Endpoint Manager Admin Center, then select Configuration Profiles in the Policy section.
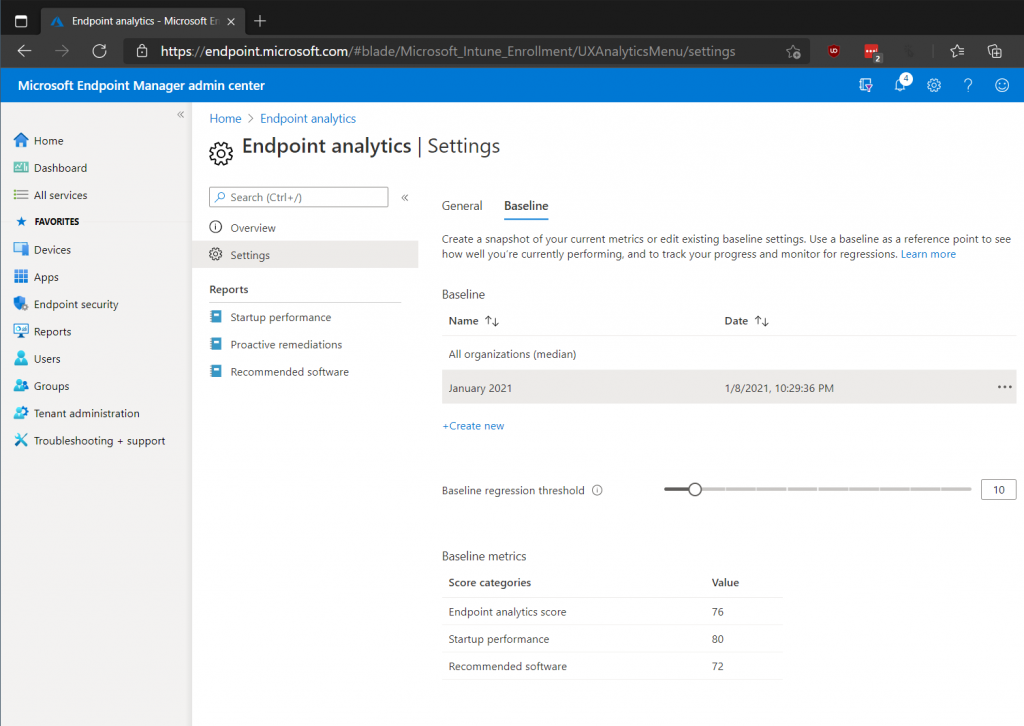
If we go back to Settings in Endpoint Analytics there is an additional tab called Baselines. Here we can create a snapshot of our current metrics data that can act as a reference point. This makes it much easier to see if there have been an increase or decrease in metric score over time. In the example below a snapshot for January 2021 has been created, this baseline can now be used in the Endpoint Analytics overview and in the different reports available.
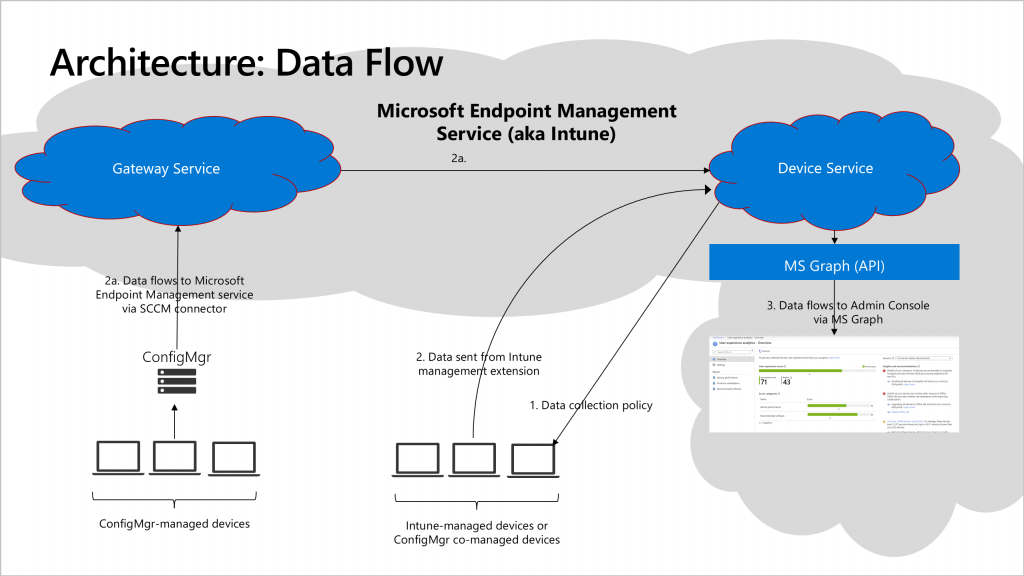
Once devices have received the data collection policy they should be restarted, it can then take 24 hours for results to be displayed in the Endpoint Analytics console. Now that we have Endpoint Analytics up and running and data is being populated from our devices, check out the other posts in the series to explore Endpoint Analytics further:
- Part 1 – Getting Started with Endpoint Analytics (this post)
- Part 2 – Startup Performance
- Part 3 – Proactive Remediation’s
- Part 4 – Recommended Software
- Part 5 – Restart Frequency

