Microsoft has announced a new Autopilot Diagnostics screen that makes it much easier to troubleshoot and retrieve logs during deployment. The scenario only work with User Driven Azure AD Join, but will probably be made available to the other Autopilot scenarios in the future. The Autopilot Diagnostic feature is available in Windows 11 builds but also in Windows 10 21H2 that is expected to release sometime in October. This is a much welcomed feature, because troubleshooting Autopilot deployments have been a pain in the past.
The overall design of the diagnostic page is simple and intuitive for end-users, yet provide administrators with the insights they need to troubleshoot issues with Autopilot. The Autopilot Diagnostic page also provides the user with a simple way of exporting logs for further analysis. In my opinion this is a great tool and a must have for anyone doing Autopilot deployments. There are always a few improvements that can be made though. Firstly instead of collecting logs to the computer or an external drive, I would love to see Microsoft automatically upload these logs to the Endpoint Manager Console, like the the device diagnostics feature in Intune. This would make it possible for an administrator to retrieve log files without needing to contact the user. Secondly the policy names should be more generic, instead of displaying an ID the actual application name would make it much more easy to troubleshoot.
Contents
Adjusting the Enrollment Status Page
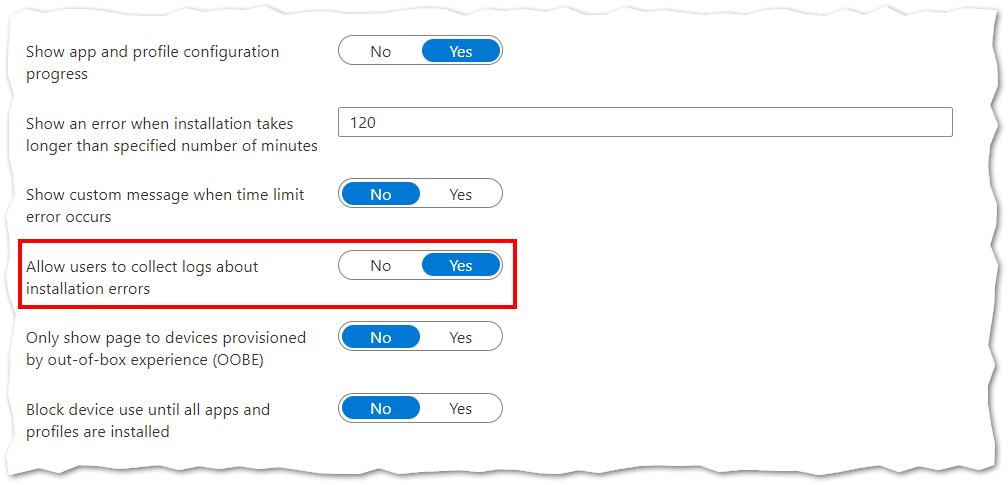
The only requirement besides an Autopilot Device with an updated Windows 10 or Windows 11 build is that the ESP (Enrollment Status Page) settings need to allow users to collect information about any installation errors.
This setting can be found under Devices -> Enroll Devices -> Windows Enrollment -> Enrollment Status Page in Microsoft Endpoint Manage Admin Center.
User Experience
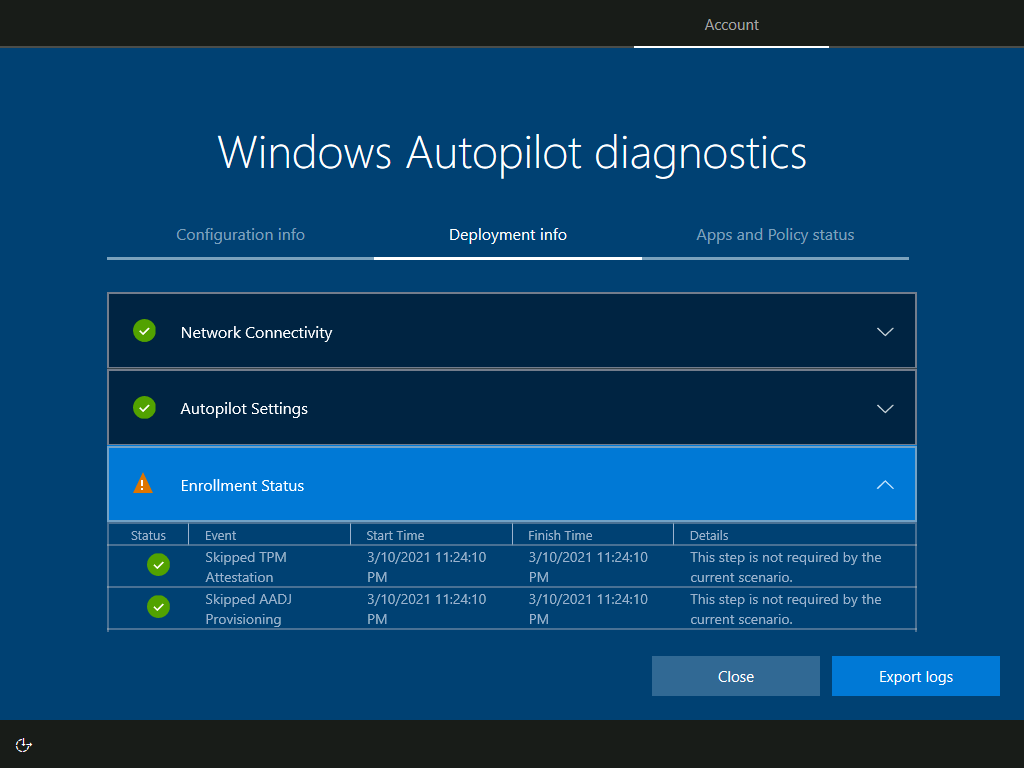
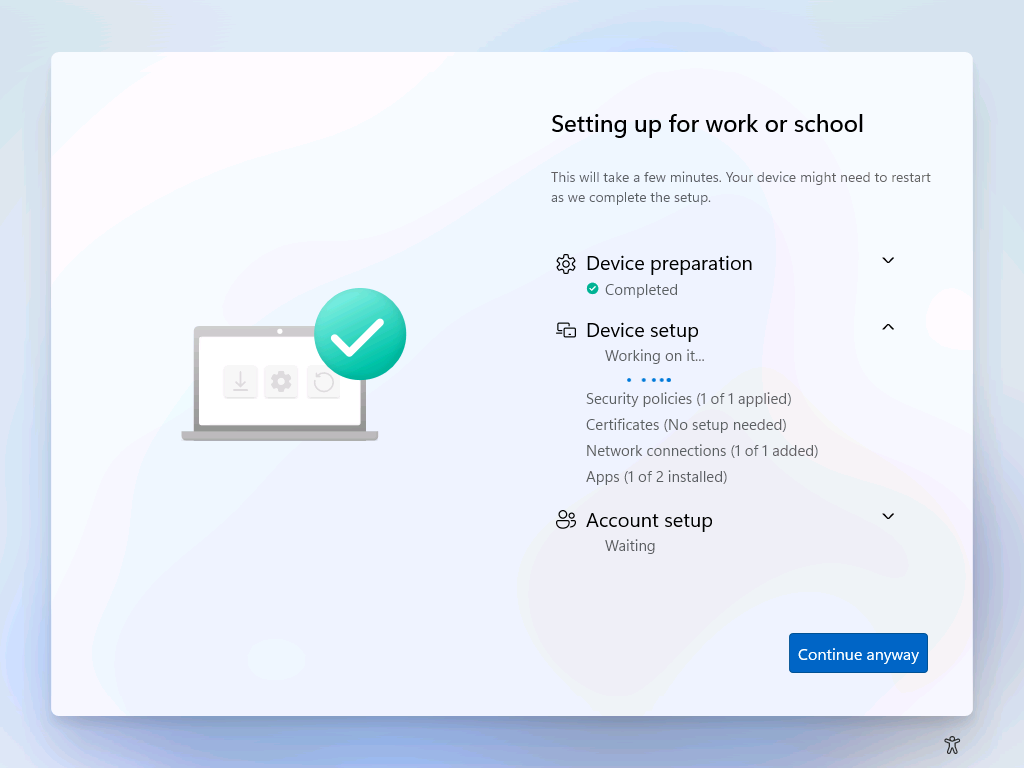
At the OOBE (out-of-box experience) screen the user is greeted with the organizational sign-in page (setup for work in the case of Windows 11) and asked to sign-in. It is possible to activate the diagnostics page prior to deployment, though naturally there wont be much information available. The Windows Autopilot Diagnostics contains three screens (Configuration, Deployment and Apps/Policies info).
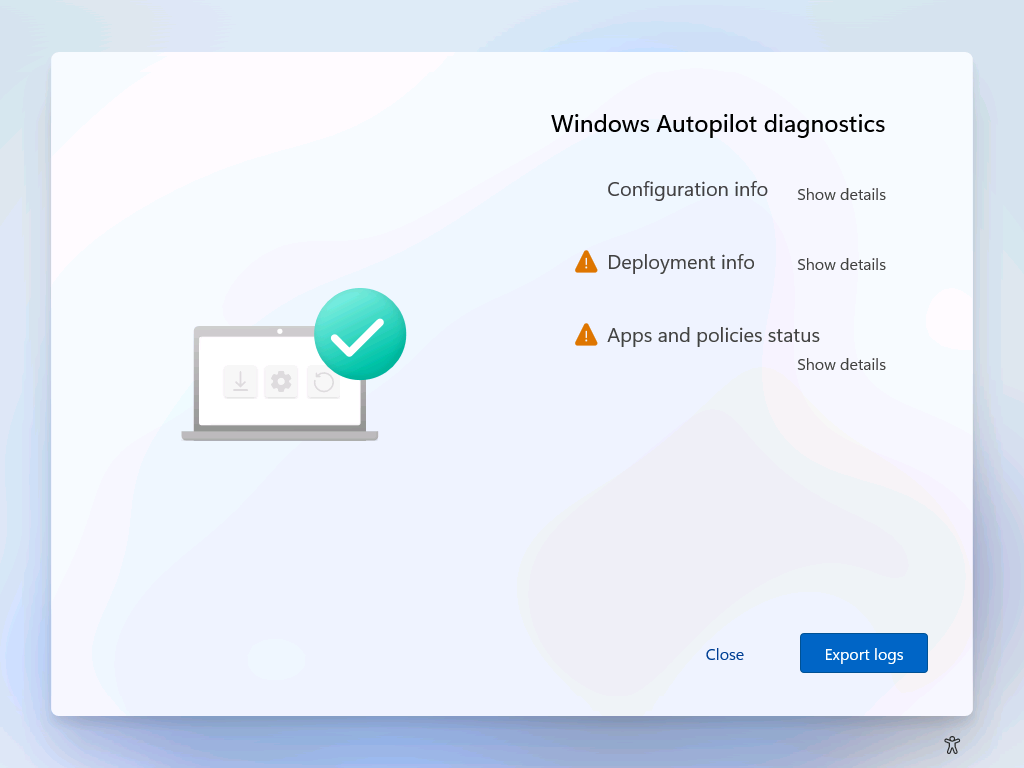
To activate the Windows Autopilot Diagnostic page press Ctrl + Shift + D anytime during Autopilot provisioning. Obviously the Diagnostics Page will also be displayed to the end-user if anything goes wrong during deployment.
When the Deployment Info tab is expanded and shows information regarding AutoPilot Settings, Enrollment Settings and Network Connectivity.
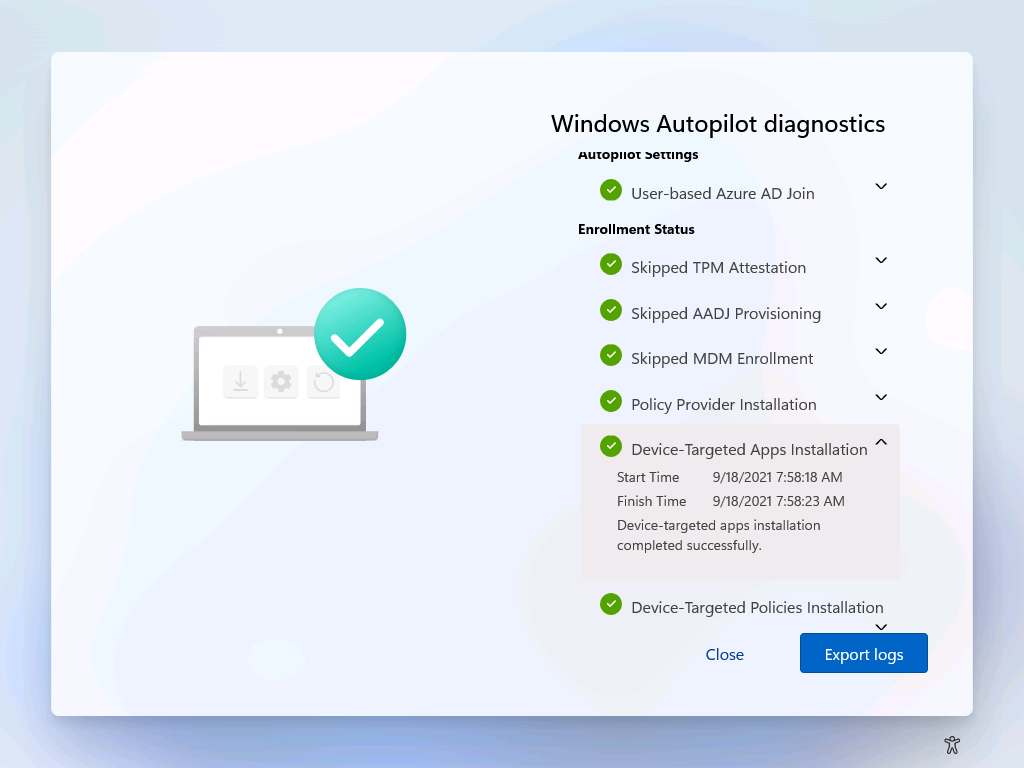
We can dig into what applications have been installed and if any failed. Microsoft should look at displaying the names of applications and polices rather than the ID.
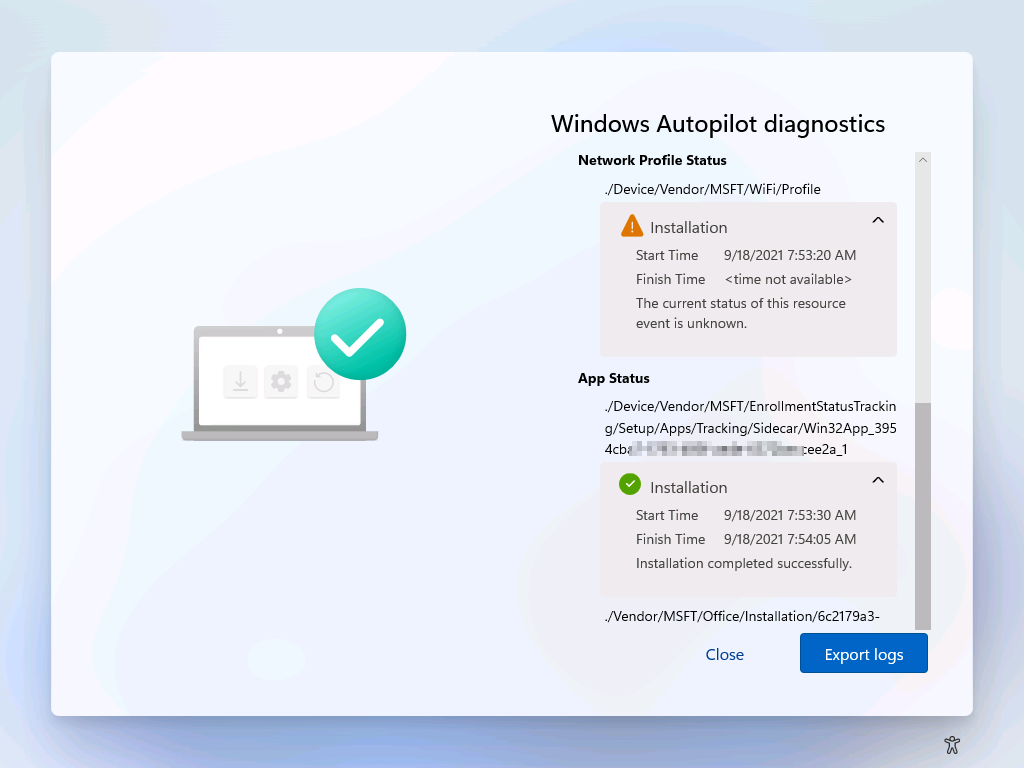
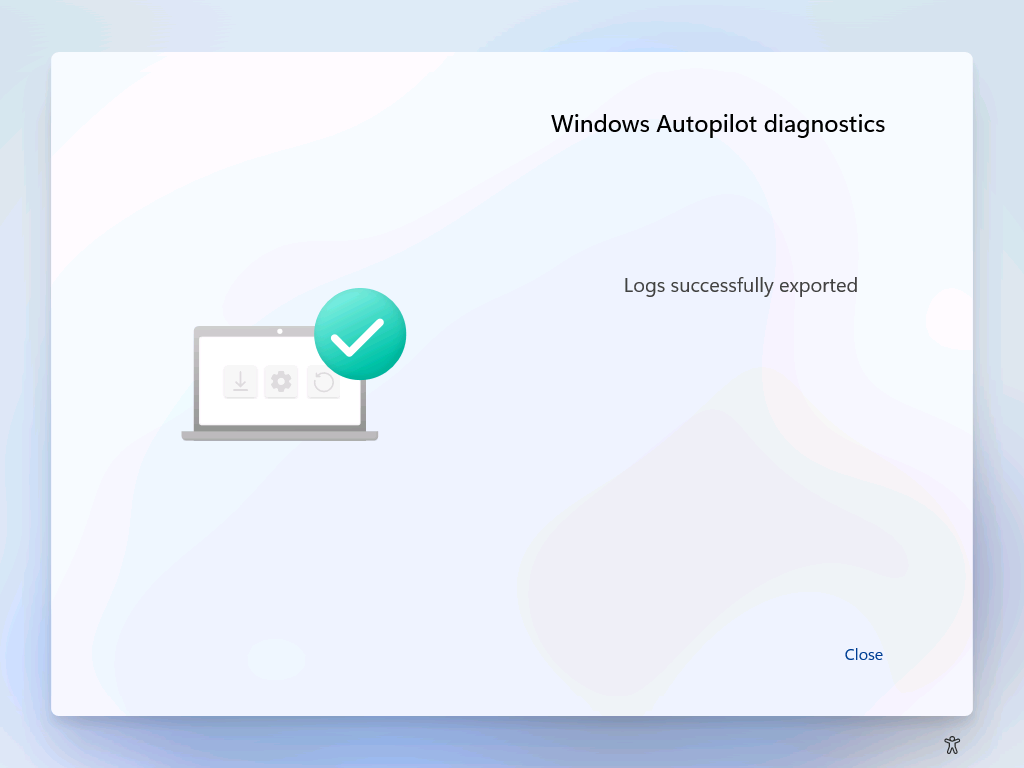
By Clicking the Export Logs button the user is provided a Save-As dialogue and saves a set of log files to the device/external drive that can be later diagnoses by the system administrator. As mentioned before, it would great if the diagnostics screen could automatically upload these files to the the Endpoint Manager Admin Center.